Close Menu
Investment GuideInvestment Guide

    How to Build a Diversified Bond Portfolio: Tips for Investors

    16th May 2025

    How to invest in online gambling companies: tips for beginners

    16th May 2025

    Why is Trust the Essence of Every Investment?

    15th May 2025

    8 tips for creating the perfect outdoor entertaining space as barbecue season begins

    13th May 2025
    Facebook X (Twitter) Instagram
    • Stamp Duty Calculator
    • Lease Extension Calculator
    Facebook X (Twitter)
    Investment GuideInvestment Guide
    • Home
    • About
      • Authors
    • News
    • Tools
      • Stamp Duty Calculator
      • Lease Extension Calculator
    • Guides
      • Digital Investments
      • Getting Started
      • Investment Strategies
      • Specialist Investments
      • Other
    Investment GuideInvestment Guide
    Home » Historical Stamp Duty Rates & Charges (Adjusted for Inflation)
    Other

    Historical Stamp Duty Rates & Charges (Adjusted for Inflation)

    Helen BarklamBy Helen Barklam21st April 2020Updated:4th May 2023No Comments4 Mins Read
    Facebook Twitter Pinterest LinkedIn Tumblr WhatsApp Email
    Stamp Duty
    Share
    Facebook Twitter LinkedIn WhatsApp Pinterest Email

    Stamp duty was first introduced in England in 1694 and originally covered all paper transactions such as gold/silver purchases, insurance policies, advertisements, newspapers and lottery tickets. Each of these documents required a physical stamp, hence the name. Stamp duty today has dramatically reduced in scope and is levied on security and property purchases, with other areas largely abolished.

    The ‘Stamp duty land tax’ refers to the tax levied on property purchases in the UK, which varies based on the value of the property purchase. This was introduced in its current form from 3 December 2014. However, stamp duty has been levied on property transactions for many years. In this article, we will compare the level of stamp duty charged on property transactions between 1984 and 2019, using property purchase prices adjusted for inflation.

    For the latest stamp duty rates, check our stamp duty calculator.

    Historical stamp duty analysis for purchases of main residential property

    The charts below show the output of this analysis prepared using the following methodology:

    • The stamp duty %’s applied for each year are those applicable at the end of each respective calendar year.
    • The calculation is based solely on standard property purchases for main residential property, ignoring special rates for first time buyers or second home purchases.
    • Stamp duty comparisons have been drawn on purchases of £100,000, £200,000, £300,000, £500,000, £1.0 million and £2.0 million.
    • RPI has been applied to take inflation into account (sourced from the ONS).
    • For example, a £100,000 purchase price is the equivalent of a £30,108 purchase in 1984 (dividing by cumulative inflation multiplier of 3.32). This would have attracted stamp duty of £301 (based on 1.0%), which is the equivalent of £1,000 today (multiplying by the cumulative inflation multiplier of 3.32).
    READ ALSO:  Italian Landmarks: History, Beauty

    Stamp duty comparative analysis output

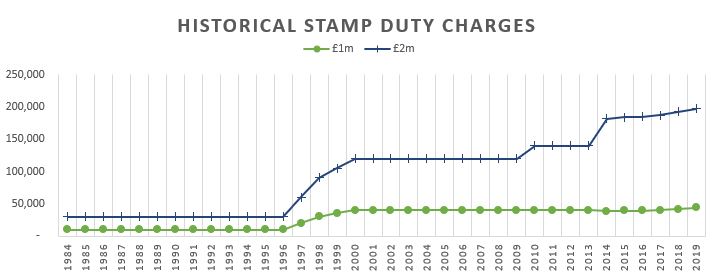
    The first chart shows the comparative stamp duty charges based on property purchases of £1.0 or £2.0 million (with the purchase values being reduced historically to provide a comparative analysis, taking account the reduction in the value of money due to inflation).

    Historical Stamp Duty Rates

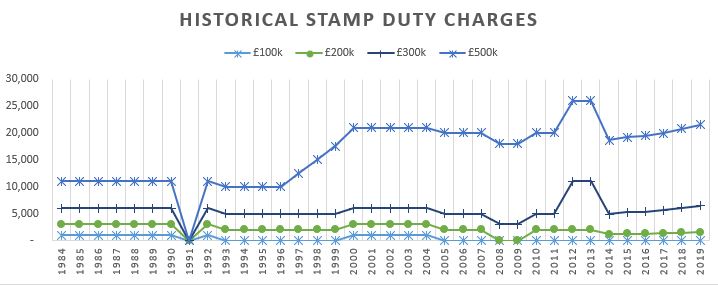
    The second chart shows the comparative stamp duty of smaller property purchases of £100,000, £200,000, £300,000 and £500,000 (with the purchase values being reduced historically to provide a comparative analysis, taking account the reduction in the value of money due to inflation).

    This analysis shows that from 1996 onwards, the Government has consistently sought to increase the relative stamp duty on large property purchases, particularly in the case of properties transacting for £2.0 million and above.

    Historical Stamp Duty Rates

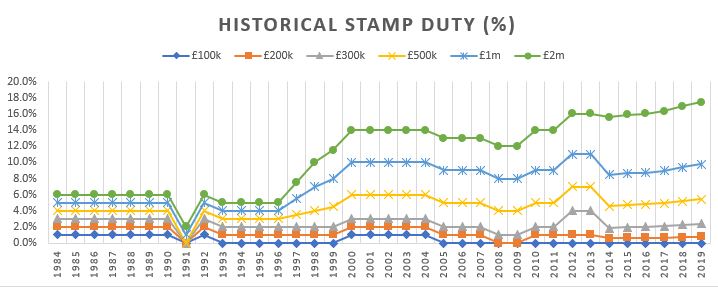
    Finally, the third chart shows all property purchase categories on one chart, with the the historical stamp duty shown as a % of the property purchase price.

    This analysis shows that purchases of £500,000 were similarly caught by the increases between 1996 and 2000, whilst the relative stamp duty payable on smaller purchases of between £100,000 and £300,000 remaining broadly in line.

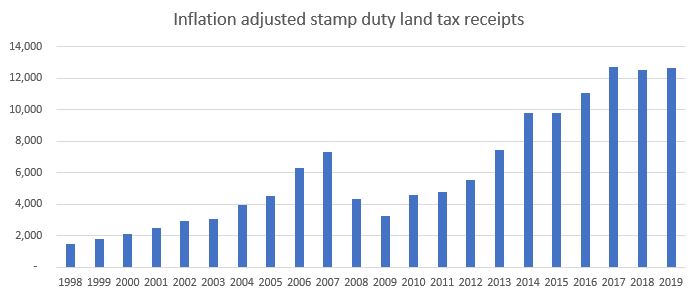
    Stamp Duty Land Tax Receipts

    Unsurprisingly, the Government has dramatically increased its stamp duty collections as a result of (i) these rate increases over the years and (ii) house prices rising at levels higher than inflation. The chart below shows stamp duty land tax receipts between 1998 and 2019 (source: ONS) adjusted for inflation. This data shows a 10.7% compound annual growth rate.

    Historical stamp duty rates

    All rates became effective from the date shown. Note that up until 3 December 2014, the stamp duty land tax was calculated as a singular % of the total property purchase price. From 3 December 2014 onwards, a new banding system was introduced whereby different rates are payable for different portions of the purchase – see the ‘3 December 2014’ section below for a worked example.

    READ ALSO:  What is a market correction in finance?

    13 March 1984

    RateCharge band
    0%Up to £30,000
    1%Over £30,000

    20 December 1991

    RateCharge band
    0%Up to £250,000
    1%Over £250,000

    20 August 1992

    RateCharge band
    0%Up to £30,000
    1%Over £30,000

    16 March 1993

    RateCharge band
    0%Up to £60,000
    1%Over £60,000

    8 July 1997

    RateCharge band
    0%Up to £60,000
    1%Over £60,000 and under £250,000
    1.5%Over £250,000 and under £500,000
    2%Over £500,000

    24 March 1998

    RateCharge band
    0%Up to £60,000
    1%Over £60,000 and under £250,000
    2%Over £250,000 and under £500,000
    3%Over £500,000

    16 March 1999

    RateCharge band
    0%Up to £60,000
    1%Over £60,000 and under £250,000
    2.5%Over £250,000 and under £500,000
    3.5%Over £500,000

    28 March 2000

    RateCharge band
    0%Up to £60,000
    1%Over £60,000 and under £250,000
    3%Over £250,000 and under £500,000
    4%Over £500,000

    17 March 2005

    RateCharge band
    0%Up to £120,000
    1%Over £120,000 and under £250,000
    3%Over £250,000 and under £500,000
    4%Over £500,000

    23 March 2006

    RateCharge band
    0%Up to £125,000
    1%Over £125,000 and under £250,000
    3%Over £250,000 and under £500,000
    4%Over £500,000
    READ ALSO:  What is a convertible bond and how can I invest in one?

    3 September 2008

    RateCharge band
    0%Up to £175,000
    1%Over £175,000 and under £250,000
    3%Over £250,000 and under £500,000
    4%Over £500,000

    1 January 2010

    RateCharge band
    0%Up to £125,000
    1%Over £125,000 and under £250,000
    3%Over £250,000 and under £500,000
    4%Over £500,000

    1 April 2010

    RateCharge band
    0%Up to £125,000
    1%Over £125,000 and under £250,000
    3%Over £250,000 and under £500,000
    4%Over £500,000 and under £1,000,000
    5%Over £1,000,000

    21 March 2012

    RateCharge band
    0%Up to £125,000
    1%Over £125,000 and under £250,000
    3%Over £250,000 and under £500,000
    4%Over £500,000 and under £1,000,000
    5%Over £1,000,000 and under £2,000,000
    7%Over £2,000,000

    3 December 2014

    The rules were overhauled in December 2014. Prior to this date, the applicable stamp duty percentage was applied to the entire purchase price. Under the new rules, stamp duty rates are only applied to the portion of the property purchase value. For instance, a property purchase of £300,000 would result in stamp duty of £5,000 calculated as: £0 on the first £125,000, £2,500 on the next £125,000 (2% * £125,000) and £2,500 on the next £50,000 (5% * £50,000).

    RateCharge band
    0%Up to £125,000
    2%Over £125,000 and under £250,000
    5%Over £250,000 and under £925,000
    10%Over £925,000 and under £1,500,000
    12%Over £1,500,000
    Share. Facebook Twitter Pinterest LinkedIn Tumblr WhatsApp Email
    Helen Barklam

    Helen Barklam is Editor of Investment Guide. Helen is a journalist and writer with more than 25 years experience. Helen has worked in a wide range of different sectors, including health and wellness, sport, digital marketing, home design and finance. Helen aims to ensure our community have a wealth of quality content to read and enjoy.

    Related Posts

    A Guide to Using AI for Video Content Marketing

    24th February 2025

    Vyvy Manga

    9th October 2024

    Mashtag Brady

    9th October 2024

    OTS Taxi

    7th October 2024

    Mashtag brady net worth

    5th October 2024

    Tamilyogi

    26th September 2024
    Add A Comment
    Leave A Reply Cancel Reply

    How to Build a Diversified Bond Portfolio: Tips for Investors

    By Sam Allcock16th May 2025

    Building a diversified bond portfolio is an essential strategy for any investor looking to manage…

    How to invest in online gambling companies: tips for beginners

    16th May 2025

    Why is Trust the Essence of Every Investment?

    15th May 2025

    8 tips for creating the perfect outdoor entertaining space as barbecue season begins

    13th May 2025
    Facebook X (Twitter)

    Company

    About

    Contact

    Authors

    Privacy Policy

    Terms and Conditions

    Categories

    Home

    News

    Stamp Duty Calculator

    Lease Extension Calculator

    Guides

    © 2025 Investment Guide

    Type above and press Enter to search. Press Esc to cancel.