
Price Volume revenue bridge
Price volume revenue bridges allow you to determine what has driven revenue increases or decreases between two or more financial periods.
In order to create a price volume bridge, you just need to know revenue and volume information for the relevant periods. From this information, you can calculate average sales price and ultimately the price and volume movements.
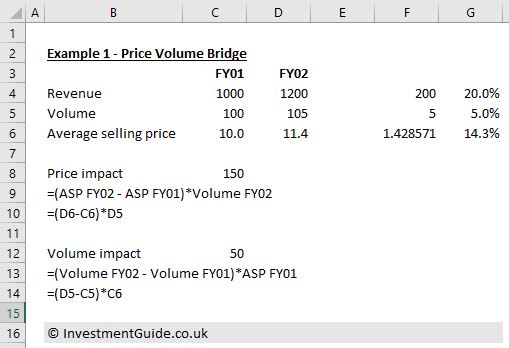
In the above example, revenue has increased from £1,000 in FY01 to £1,200 in FY02 (£200 or 20% growth). Volumes have increased from 100 to 105 (5 unit or 5% increase) whilst average sales price has increased from £10 to £11.4 (£1.4 or 14% increase).
In this example, of the £200 growth in revenue, £150 was attributed to price increases and £50 attributable to volume growth. This is calculated as follows:
Price impact
In order to calculate the price impact, you need to take (average sales price in FY02 (£11.4) minus the average sales price in FY01 (£10.0)) multiplied by the volume in FY02 (105). This results in a price impact of £150.
Volume impact
The volume impact is calculated by taking (volume in FY02 (105) minus volume in FY01 (100)) multiplied by the average sales price in FY01 (£10.0). This results in a volume impact of £50.
In this example, of the £200 growth in revenue, £150 was attributed to price increases and £50 attributable to volume growth.
What about the impact of mix?
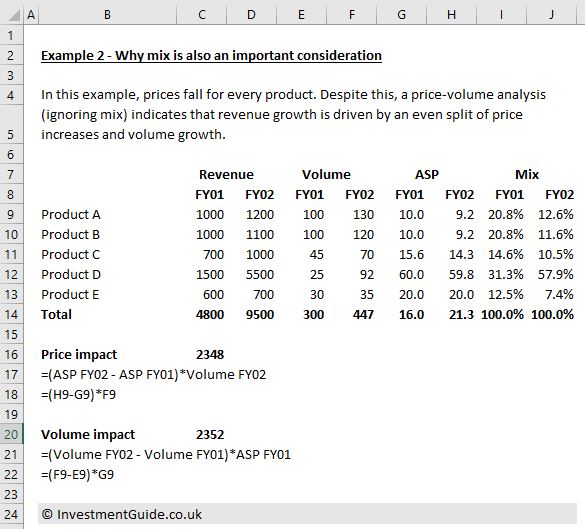
Using a price volume analysis is useful when looking at a single product/SKU. However, it is less useful when looking at the overall impact of price and volume where a business has multiple products as the output can be skewed.
The example below illustrates this perfectly because whilst prices for individual products have fallen, the price impact when using the price-volume bridge formulas appears positive.
Price Volume Mix revenue bridge
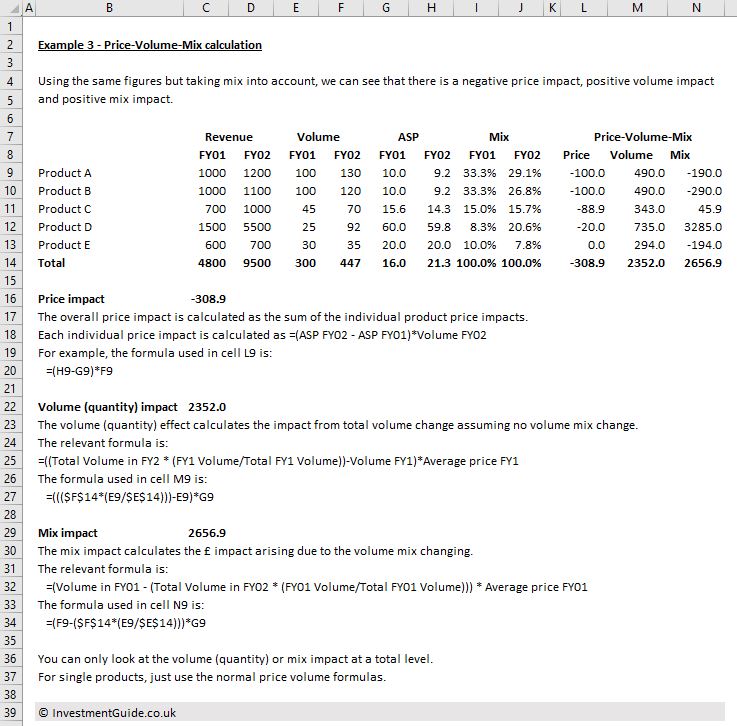
Following on from the above example, by factoring in an additional ‘mix’ bridging item, we see a negative price impact, positive volume impact and positive mix impact.
Price impact
The price impact for individual products is calculated in the same way as noted above (i.e. =(ASP FY02 – ASP FY01)*Volume FY02).
The overall price impact is calculated as the sum of the price impact for each individual product (i.e. the price impact for Product A, B, C, D and E).
Volume (quantity) impact
The volume (quantity) impact is calculated by: ((Total Volume in FY02 * (FY01 Volume/Total FY01 Volume))-Volume FY01)*Average price FY01.
The overall volume (quantity) impact is calculated as the sum of the price impact for each individual product (i.e. the price impact for Product A, B, C, D and E).
Mix impact
The mix impact for individual products is calculated by using: (Volume in FY01 – (Total Volume in FY02 * (FY01 Volume/Total FY01 Volume))) * Average price FY01.
The overall mix impact is calculated by taking the sum total of the mix impacts for each individual product.
It doesn’t really make sense to look at the volume (quantity) or mix impact when looking at individual products. For single products, you would use the normal price volume formulas. However, when looking at the overall price volume trend, it is important to consider mix as otherwise the price/volume outputs are likely to be skewed.
5 Comments
Thank you so much for the clear explanation.
It helped me a lot in my analysis.
Greetings from Brazil. =)
The only place I understand. Very clear and clear explanation. Thank you so much. Could you also add how we will calculate the new product effect?
In the Mix formula, the text mentions Volume in FY01, which is Column E in the Excel sheet. However, the actual formula uses column F, which is the Volume in FY02. There appears to be a disconnect unless I am missing something.
Hi, thanks a lot for this. Great explanation. Could it be that, in the mix formula, the first element (Volume in F01) is actually Volume in F02? The cell F9 refers to F02 but the written formula mentions F01. Maybe I’m wrong. Hope it helps!
Thank you for the great explanation, I think on the last mix calculation where you have put F9 in the formula that is correct you have mistakenly put FY01 when it should be FY02 in the text example. Commenting more for other peoples benefit as they read through it