Discounted Cash Flow (‘DCF’) is the most common valuation method employed by those in private equity or investment banks. The technique involves calculating the present value of expected future cash flows.
It’s useful to initially think about this concept in the context of a publicly listed businesses. An investor acquiring 10 shares in ABC PLC is doing so in order to hopefully profit from future dividend receipts and/or any capital appreciation via the ultimate sale of those 10 shares to another investor. The price of the 10 shares today therefore depends on the present value of all future dividends that the shares are expected to pay to its owner.
Cash flow generation drives the ability to make dividend payments. If a firm is not generating positive cash flow, it will be unable to sustain dividend payments to shareholders. In order to calculate the total value of all future cash flows, we first need to calculate the unlevered forecast cash flow of a firm using Management projections (or adjusted projections where we wish to make alternative assumptions)
Discounted cash flow methodology
Calculating unlevered free cash flow
A DCF typically starts from NOPAT (Net Operating Profit Less Adjusted Taxes). To get NOPAT, you take EBIT and deduct a theoretical cash tax value (EBIT * corporation tax rate).
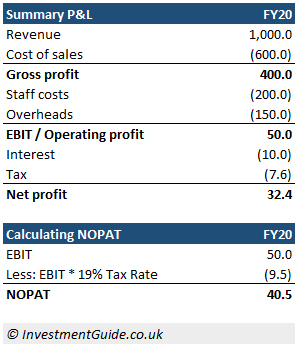
By calculating corporation tax based on EBIT, we ignore the tax shield that the company would have received on its interest expense. For example, if a company has 50 EBIT and interest of (10), it would normally only pay corporation tax on the 40, whereas we assume taxes are paid on the 50 EBIT. Taking this approach means that we are calculating the unlevered free cash flow, which ignores the businesses current capital structure.
The valuation is therefore based on the enterprise value of the business. This makes sense because businesses are bought and sold on a cash-free debt-free basis and the capital structure going forward is likely to change.
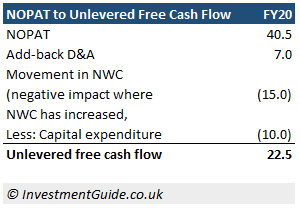
Once you have NOPAT, you add-back depreciation and amortisation (non-cash items), add back any negative movements in net working capital (or deduct where net working capital has increased) and deduct any capital expenditure to arrive at unlevered free cash flow.
Financial modelling
The starting point for any DCF model is a 3 statement financial model (profit and loss, balance sheet, cash flow), which links the three financial statements together.
In general, analysts build this forecast cash flow for a five-year period as the further you try to forecast into the future, the less precise/accurate it becomes. When we conduct our DCF valuation, we must then calculate a terminal value to determine the value of forecast cash flows beyond that point.
This article will not go into detail about how to create the full financial model. Instead, it focuses purely on calculating discounted cash flows, assuming you already know how to build or are at least familiar with the concept of a financial model.
Discounting future cash flows
Cash now is worth more than cash in the future. This is because if you were presented with the option of receiving £1,000 today or £1,000 in 10 years time, you would pick the £1,000 now because you could invest that cash could be invested so that it was worth more in the future. Even if you placed the cash in a low interest bank savings account, you would expect to receive a interest from the bank.

In order to calculate the present value of future cash flows, we therefore need to establish an appropriate discount rate to use.
If the business will have no external debt (i.e. cash flows will solely pass to equity holders), a discount rate based on the ‘cost of equity’ should be used. However, where a business will have external debt (i.e. cash flows will pass to both equity and debt holders), a discount rate based on the weighted average cost of capital (‘WACC’) should be used. The WACC takes into account both the cost of equity and the cost of debt, proportional to the amount of debt and equity held by the business.

The WACC formula also takes into account the tax shield received from interest payments made on debt held by the business.
Calculating the cost of debt
The cost of debt is the average interest rate that is paid on debt held by the company. Note that where a takeover is being considered, the cost of debt going forward under new ownership may vary compared to the rate that the business had access to historically. For example, where a corporate is acquiring a company and it has a higher credit rating.
In order to calculate the cost of debt, you must calculate the amount of interest payable in respect of each debt holding that the company has. Once this information is collated, the cost of debt is the weighted average interest rate % across all debt holdings.
Clearly, if the company itself or its advisors are calculating the DCF, it will have easy access to this information. However, if you are seeking to calculate the cost of debt for a company where you do not have this access, there are a few different methods available:
- Public companies may hold observable debt in the market. Where this is true, you can use this public information to calculate the yield to maturity of a specific bond. This is fairly straight-forward where the company has a simple capital structure with few different types of debt, but quickly becomes complicated where the business holds numerous complex instruments.
- Alternatively, you can source a business’s credit rating from a credit rating agency such as Moody’s, Fitch or S&P. Corporate credit ratings are useful benchmarks as you can either: (i) contrast vs. the cost of debt in other companies with a similar rating, or (ii) look at the yield spread over US treasuries for that specific credit rating and add that spread to the risk-free rate to determine the cost of debt.
- A third, fairly simplistic approach would be to divide the total annual interest expense per the profit and loss by the total debt per the balance sheet to get an approximate cost of debt percentage.
Calculating the cost of equity
Calculating the cost of equity is slightly more complicated than the cost of debt. It is calculated with reference to the Capital Asset Pricing Model (CAPM).
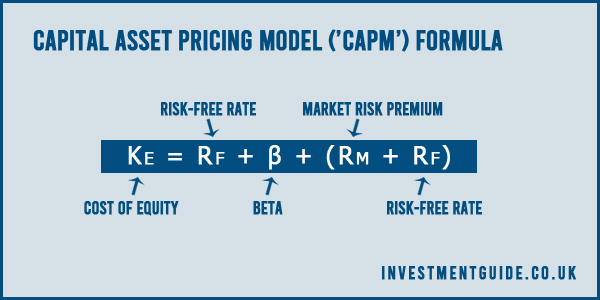
The CAPM formula stated that the cost of equity is equal to the risk-free rate + (Beta * the market risk premium). So what do we mean by each of these components?
Risk-free rate
The risk-free rate is theoretically the rate at which you could invest your money without opening yourself up to any risk whatsoever. Whilst no investment holds zero risk, the risk-free rate is commonly associated with the yield you could obtain on a 10-year government bond. The risk-free rate used will typically correspond to the market in which the company is operating in.
Beta
Beta is a statistical measure of the share price volatility of a company compared with the volatility of the market as a whole. Statistically speaking, you are looking at a share prices covariance with the rest of the market, divided by its own variance. However, have no fear, the beta of public companies can be freely obtained online without performing any calculations from sources such as Yahoo Finance.
A beta less than 1 indicates that the stock is less volatile than the market in general, whereas a beta in excess of one conversely means that the stock is more volatile.
If you need to calculate a Beta for an unlisted company, the most common approach is to find the average beta of publicly traded companies that generate revenue from the same or similar markets. Once you have obtained the beta values for each of these companies, you should unlever the beta values, take the average of those unlevered betas, and then relever to take into account the debt/equity ratio of the unlisted company you are analysing. The graphic below shows the step by step approach required.
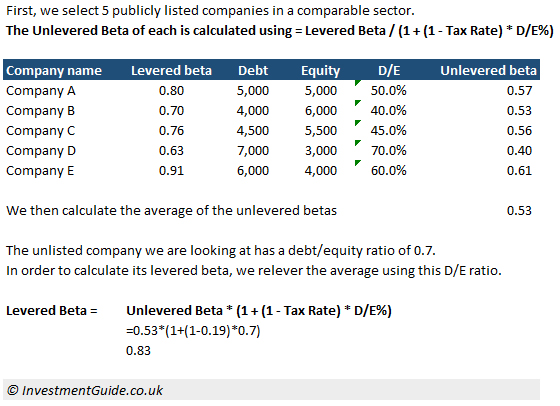
There are, however, limitations of this approach. For example, it does not take into account what could be a significant size differential between the publicly listed company and the unlisted company.
Market risk premium
The market risk premium is effectively the additional return an investor would expect over and above the risk-free premium rate for holding the asset. It is usually calculated with reference to the performance of the market which the specific company is a part of (e.g. it could be calculated with reference to FTSE 250 performance in the last year). If the FTSE 250 grew by 7% and the risk free return is 2%, then the market risk premium would be 5% in this scenario.
Calculating the present value of unlevered cash flow
Now that we know how to calculate WACC, we can start our calculation to figure out the present value of all future cash flows.
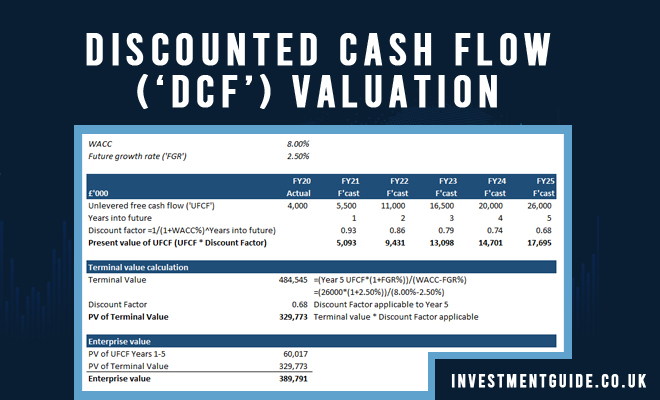
The first step is calculating the present value of specifically forecast cash flows, which is typically a 5 year outlook in most forecast models. This is done by taking total unlevered cash flow forecast in each of those 5 periods, and discounting them using the formula (1/1+WACC)^Years into future.
Once this step is complete, you must calculate terminal value using the formula: =(Year 5 UFCF*(1+FGR%))/(WACC-FGR%), where FGR% represents an assumed annual future growth rate. Once calculated, apply the year 5 discount factor (or the discount factor applicable to the period you are using to calculate terminal value) to generate the present value.
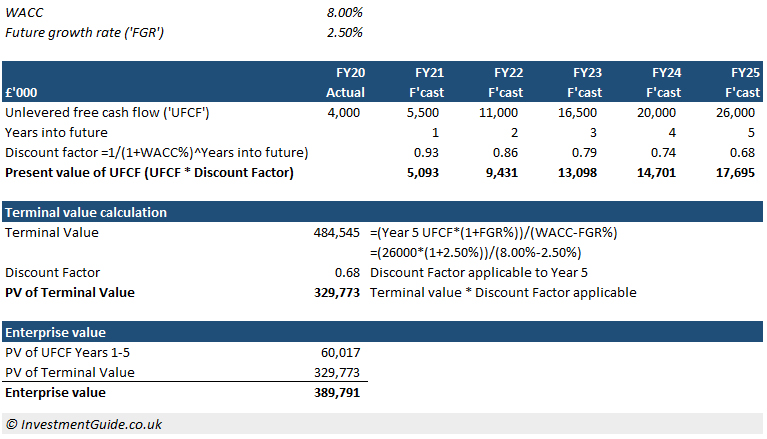
The total of the present value of our Year 1-5 unlevered free cash flow, plus the present value of our terminal value, equals enterprise value.
Enterprise value to equity value
Enterprise value represents the headline price of the business. However, the cash ultimately paid should be the equity value because transactions are conducted on a cash-free, debt-free basis.
The enterprise value to equity value bridge involves (i) adding cash and cash-like items, (ii) subtracting debt and debt-like items and (iii) and making an adjustment for any difference between working capital delivered vs. the normal level of working capital the business requires.
Read our separate article on the enterprise value to equity value bridge for further detail.


